#DS. 03 — Practice (data manipulation, plot, sum, mean, etc)

This story will be short, I’m only practicing the concepts showed before *_*
— — — — — — — — — — — — — — — — — — — — — — — — — —
Github project
https://github.com/saulotp/ds_practice-manipulation-plot— — — — — — — — — — — — — — — — — — — — — — — — ——
This time I got three databases from ‘Lira hashtag — Python tips’ to practice some data manipulation and plot. The exercise has six questions about the databases mentioned before, and to answer these questions I have to manipulate some data. The questions will be written first, then I show the method that I used to find the answer below. Let’s code =)
The exercise:
What we have?
We have the 2019 data from a service provider divided into three databases:
- CadastroFuncionarios (RegisterEmployees)
- CadastroClientes (Customer Registration)
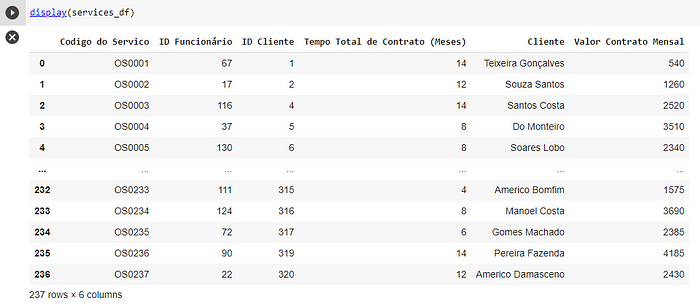
- BaseServiçosPrestados (BaseServices Provided)
And what we want to know/do?
1. Total Payroll Value -> What was the total expenditure on employee salaries by the company?
For first we have to import pandas and read the databases:
As output we have:

To know the payroll value we have to sum some data from employees database. Then I created another dataframe where I added values of ‘Salario Base’ + ‘Impostos’ + ’Beneficios’ + ‘VT’ + ‘VR’ and at least I used the sum() method to find the total payroll value:

Answering the first question, the total payroll value is R$ 2.717.493,22
2. What was the company’s revenue?
To find the company revenue I have to merge two databases, multiply two columns then sum the values:

Answering the second question, the company’s revenue is R$ 5,519,160.00.
3. What is the % of employees who have already signed a contract?
To find this information I created two variables to len() the columns count from distinct databases. In the services database we have the employees that signed some services contracts but there aren’t all the employees, then I had to consult the employees' registration to find the total of employees that we have working in the company. After all, I just did the calc to find the percentual (%) employee that had signed some contract.

Answering the third question, the % of employees who have already signed a contract is 86.84%.
4. Calculate the total number of contracts that each area of the company has already signed.
That was easy, we can just create another DF merging two databases and after this, we can count_values() from the selected column.

Or we can plot this data to make the visualization more cool. First import the library, then plot s2:
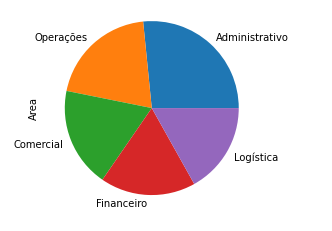
The answer to the fourth question is this image below:
5. Calculate total employees by area.
This question is the same, look:
Answering the question:

And for last. . .
6. What is the average monthly ticket (average monthly billing) of the contracts?
This question brings to us the classical problem about mean. All we have to do is create a variable to calculate the mean from “Valor Contrato Mensal” column from Services database. Code below:

Answering the last question, the mean is R$ 2.438,00
We did it ❤
That’s it. I have worked so hard on my Ph.D. and these days I don't have so much time to study Data Science, but ever as possible, I will write what I have study or learning.
Spoiler alert: ❤ I’m loving machine learning ❤ Linear regression ❤ Random Forest ❤
Bye o/
